
Sprint 1:
We set ourselves the following goals for this sprint:
- on-board the alpha team
- agree on a user research plan and begin recruitment
- begin building a prototype for user research
User research planning
We initially planned to do two rounds of user research in this alpha, given the resources and time constraints.
This did mean we wouldn't be able to take a rapid and iterative approach to prototyping in the time available, which felt like a risk to the project.
So we held a UR planning workshop to brainstorm ideas for incorporating more research.
We realised we’d have to:
- agree on what to test in round 1 of research
- identify the risks and dependencies associated with our new plan
- create mitigation strategies
- set expectations on what each team discipline needs to deliver to meet our new deadlines
We decided our first step should be to produce a stripped-back design for an allocation statement. This would present available CFS data in a layout that would be familiar to users of services such as MYESF.
By doing this and having two user researchers work in parallel, we hoped to fit in a 3rd round of research.
Early visualisations
To get the work started, we were given access to CFS and MYESF systems, so we could begin to understand funding data structures. And we mapped the data to the front-end views of both services, to see how an Application Programming Interface (API) was transforming the data into user interfaces (UI).
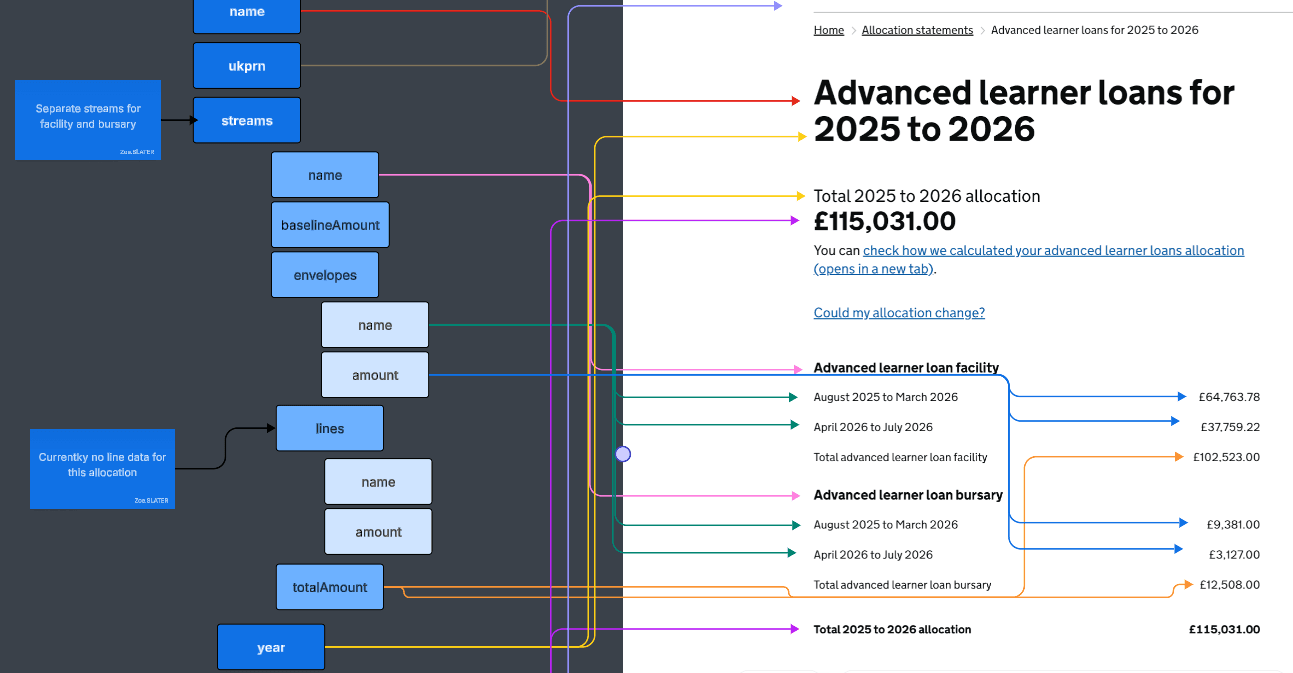 Technical and design colleagues worked together to map data fields to front-end views.
This was done for examples of adult and General annual grant (GAG) allocation statements, to understand the shape of the data, and get a sense of how similar this was likely to be across funding streams.
We found the two funding streams had very different data structures, so we knew there were going to be scalability issues. It therefore made sense to limit our scope at this stage. So, we agreed to narrow our focus, by:
- limiting our investigations to allocation statements only for now; we would investigate payment schedules and remittance advices later
- visualising an adult funding allocation statement only
Next, we mapped the data shown in a live statement example against the existing database structure, to understand if the data for the fields we needed existed in CFS.
The team also began to develop a separate API, specifically to help connect the data to our prototype.
This showed us there were issues with the data, which were going to limit how well it could be visualised. Nevertheless, we designed our first lo-fidelity prototype to reflect those limitations, by mocking up what a page would look like when it was simply populated with data as it’s found in CFS. We used Figma for this work.
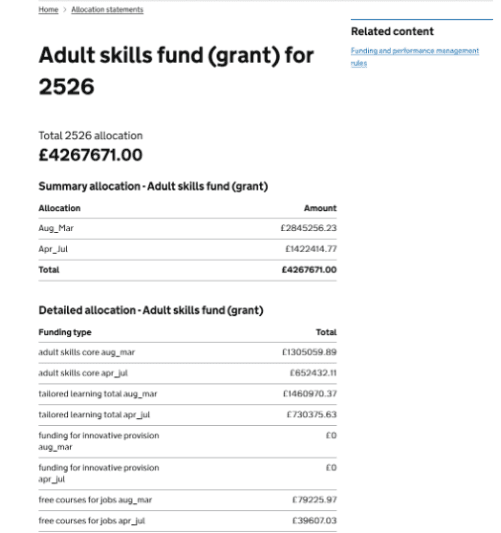
Low-fidelity prototyping helped us to visualise data outputs.
We quickly identified several problems. We could see that:
- the content did not align with gov.uk style guidelines
- it did not meet basic accessibility requirements; for example, a screen reader would have been unable to read many of the funding descriptions
- the way funding amounts were presented would not have met known user needs
This meant we could invalidate our second and third hypotheses without showing the prototype to users, namely that:
- CFS data is in the correct format to be understood by users in its current form, and
- information provided through CFS and other data repositories meets all the user needs for communicating adult allocations, payments and remittances
Some quick changes to the 1st prototype helped us to understand the extent of these issues.
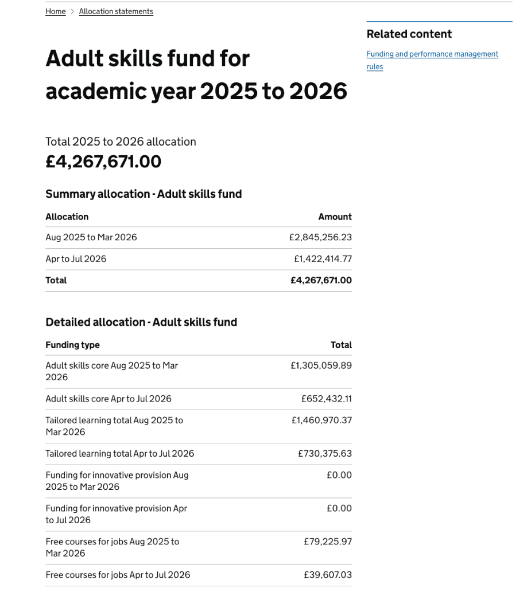
Some basic content changes helped to demonstrate that further data transformation work would be needed.
It also demonstrated that more needed to be done to give the whole team better visibility of:
- known user needs
- the work that was recently done to improve the UI for adult allocation statements in MYESF
Sprint 2:
These early experiments also helped us to see that we weren’t yet aligned as a team on which assumptions we wanted to prioritise in testing. We needed to take a step back, do a bit more groundwork and give ourselves a solid base from which to carry out analysis, prototyping and research.
We also realised we needed more time to achieve the goals set in sprint 1 and be ready for user research. So we iterated our goals. These became:
- set up an interactive proof-of-concept prototype
- carry out desk research to validate and summarise known user needs, to help inform the design of future prototypes
- gain access to CFS data and begin investigating funding calculations
- plan our approach for journey mapping and ideation
Our user researchers carried out the desk research, and they soon had the evidence that our earlier prototype did not meet user needs, accessibility, or gov.uk design standards.
Once we had access to CFS data, our data analyst could begin to explore how calculations were structured. We’d assumed there were fields in the data that could be used to generate calculations that made sense to users in a UI. In fact, the calculation structures were much more complex than we realised; many were stored in raw code, with as many as 100 lines of code per calculation.
Although we didn’t manage to produce a shareable prototype in this sprint, we did set up a local instance, and mock up a simple allocation statement page, ready for further development.
The interaction and content designers on the team have also begun thinking about what a template for automating a wide range of allocation statements could look like, by gathering examples of the components that are common to all statements and doing some initial thinking about standardising content.
Our journey mapping and ideation plans are on track too.
We’re excited about the progress we’ve made and looking forward to developing testable prototypes in sprint 3.