
The problem
After completing a module, we ask users 5 or 6 mandatory questions to rate their confidence. This is reported as an overall confidence score and is one of the key metrics used to show whether the training is effective.
However, because we only collected confidence data at the end of a module, we did not have a baseline to compare against. Without a baseline, we could not accurately show if the training has impacted users’ confidence levels and therefore, if the aims of the training are being met.
Understanding the need
This was a business need to improve how we measure the impact of the training. Adding a baseline measurement allows us to compare confidence before and after a module. This gives us a better understanding of the value and impact of the service.
We can use pre and post measures to see if the content is having the desired impact. This will help us make decisions on how to improve the service and ensure the modules are effective and impactful.
We can also use pre module answers to make decisions about new content to commission. In the future we will be able to use it to measure the impact of a bitesize module compared to full length modules.
Design process
Understanding the current ‘as is’
After defining the problem, we reviewed the current designs. Post-module confidence scores are reported to stakeholders as an average score on a 1 – 5 scale across 8 modules.
We also carried out desk research, including reviewing how other government training services use pre and post-module questionnaires. This helped us identify existing patterns and approaches.
Ideation
We held a team ideation session to explore possible solutions. We generated four viable options, assessed the pros and cons of each, and used dot voting to agree a preferred approach.
The selected option was to add a pre-confidence questionnaire at the start of each module.
Designing the pre and post-confidence questionnaires
Following ideation, we started designing in Figma at higher fidelity. We first reviewed the existing post-module confidence questions and made several improvements.
Example of previous post-module question:
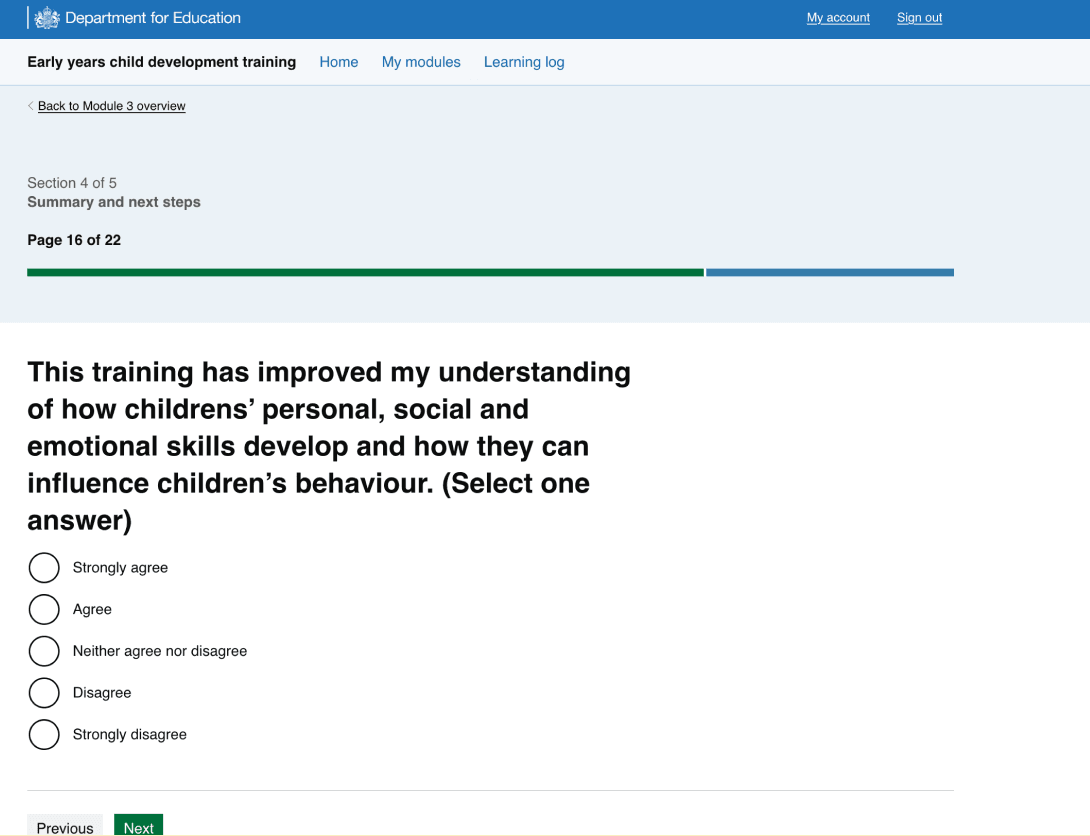
We made the following improvements:
- shortened H1s to keep them concise and easy to scan (aiming for fewer than 65 characters)
- kept the meaning of the existing questions, as they map to module sections and support reporting, but improved the wording to be clearer and more direct
- added supporting paragraph text where a heading needed more explanation, allowing us to shorten the heading while still providing enough context
- changed the confidence scale from ‘Strongly agree’ to ‘Strongly disagree’ to ‘Very confident’ to ‘Not confident at all’. This allowed us to use the same scale for both the pre and post-confidence questions, improving consistency.
Allowing users to skip the questions
The main risk of adding pre-confidence questions was adding friction at the start of the training. This could reduce module engagement and completion rates.
To mitigate this risk, users can skip the pre-confidence questionnaire. Skipped questions are recorded as missing data, rather than a neutral response.
Testing approach
We ran a design critique with other designers in the portfolio. The feedback informed the final designs and helped us shape our testing approach. We explored the following options:
- unmoderated testing with 40 participants, followed by interviews
- moderated testing with around 10 participants
Both options required building a full module prototype. We carried out a cost benefit analysis and decided to take a pragmatic approach to testing the questions in the live service . Given the time constraints, the low risk of the change and the pattern of the post-module questionnaire already existed in the live service, we decided to release the change to 3 live modules (1, 3 and 6 representing lower, moderate and higher complexity) and monitor the outcomes. This would also give us a larger sample size, which gives us more meaningful data before deciding whether to move forward with the feature.
Success measures of live testing
We measured success by monitoring:
- pre-module confidence skips rate
- the drop off rates of users
- the confidence questionnaire responses
- user research insights
Monitoring pre-module confidence skips rate
Before testing we decided that a skip rate of less than 25% of users select the skip option would be considered a success. During the testing period there was 2,500 users that completed the pre-module confidence checks and 153 (6%) of the users skipped questions.
Monitoring the drop off rate of
During testing, we wanted to monitor the user drop off rate of the pre-check to ensure users were not leaving the training after seeing the questions. A drop off was classified as a user who answered at least one question, but left without finishing them. The data showed that only 17 users out of the 2,922 dropped off (0.58%).
Monitoring the confidence questionnaire responses
We wanted to monitor how long users are spending on the pages to make sure they are reading the questions, and we wanted to monitor if users are straight lining answers. Google Analytics showed the average time spent on each page was 11 seconds and 27.58% of users straight-lined their answers.
Monitoring the pre and post answers
The live data demonstrates the average response to the pre-module confidence is 3.79 out of 5, with the post being 4.44 out of 5.
User research
As well as monitoring the live service data, we carried out 9 interviews with users to explore the confidence check questions. These interviews were followed up by moderated usability tests on the pre-confidence score questions. The users included:
- nursery practitioners
- childminders
- reception teaching assistants
- early years leaders.
Research aims
The key aims of the research were:
- to determine how users interpret the confidence questions
- how we interpret users answers
- whether the confidence ratings caused fatigue
- whether the 1-5 scale was meaningful and used consistently between the different user groups.
Users were also asked whether they were able to distinguish between the two different types of rating scales. As well as assess the flow of service and the order of the questions.
Research findings
Findings:
- user reported further content clarification on the pre-module questions would be useful so it’s clear what the question is testing
- users said they would complete the pre-module confidence score questions
- users anticipated their confidence will go up after the training so they would score their pre-module confidence with that in mind
- some users said they would score ‘neutral’ if they were unsure of the question or if they had some background knowledge on a topic but no or limited practical experience.
- the majority of users would score ‘somewhat confident’ on topics they had some experience but felt like there are gaps in their theoretical knowledge
Overall, users thought the pre-module confidence scale was a good ‘self-reflection’ mechanism what was reported as ‘helpful’. Users self-reported the questions would not deter them from completing the training.
Iterating designs and implementing across all modules
There were some content improvements including:
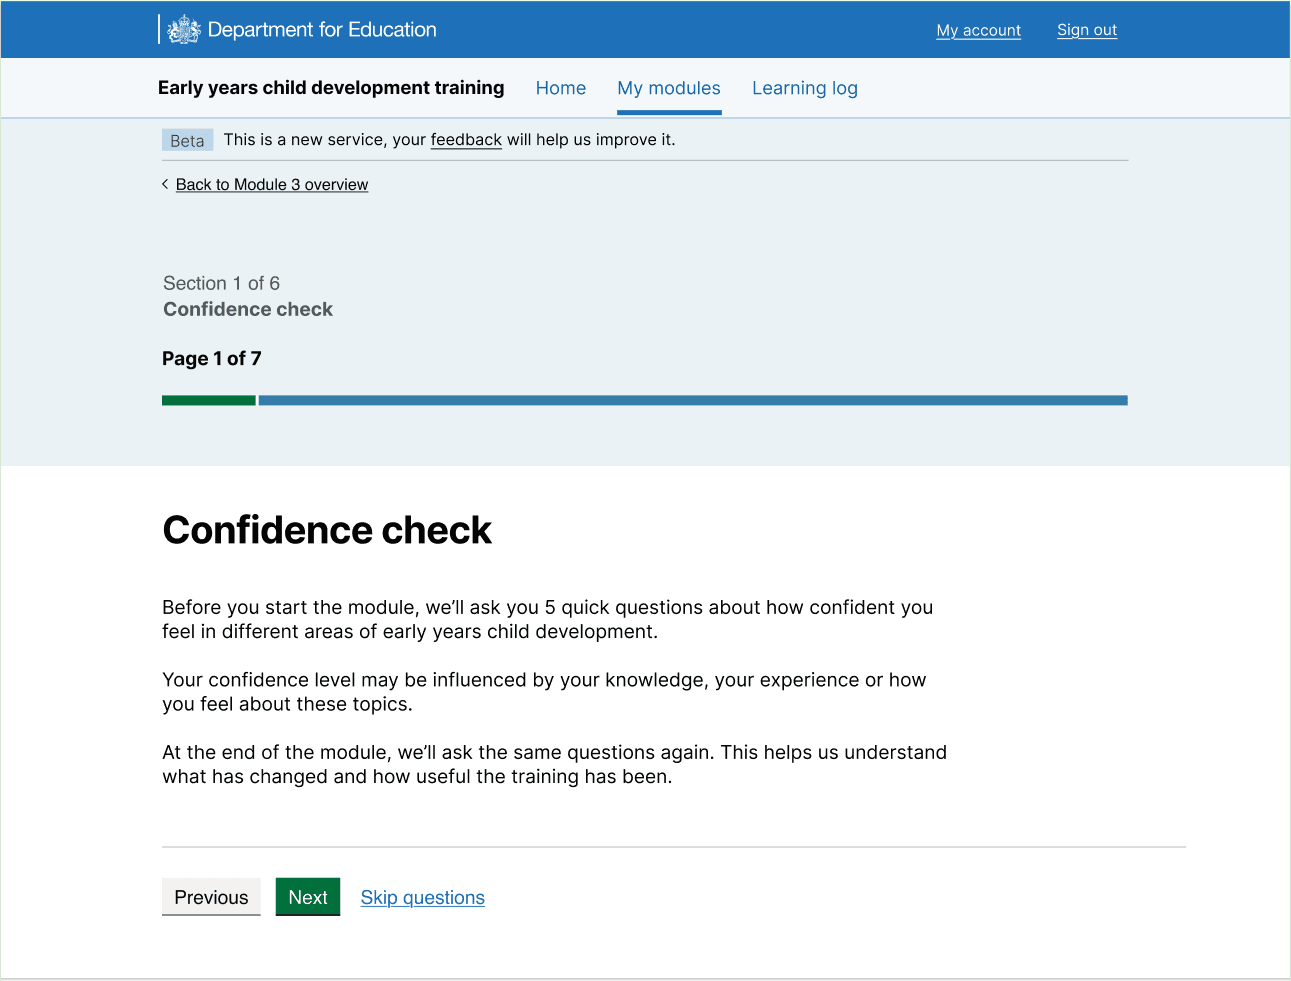
- improving the confidence check start page
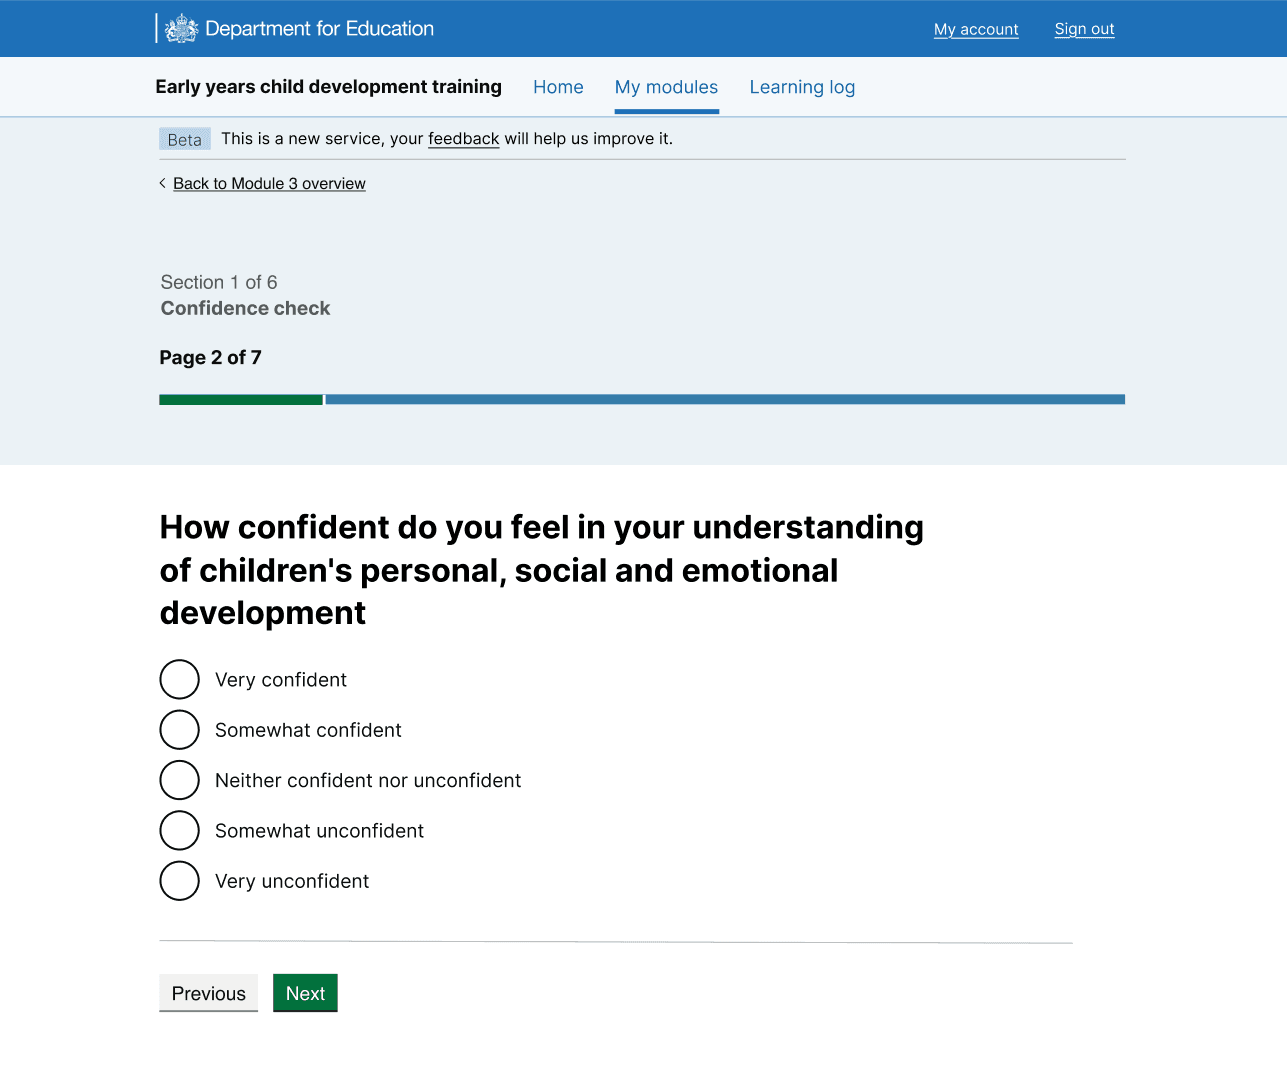
- improving the confidence scale to be clearer, for example ‘Neutral’ confidence was confusing to users
- revise the additional text underneath some questions as this caused some confusion
- separate some questions as it felt like we were asking two questions at once in some cases
Example of new confidence check start page:
Example of new confidence check question page:
Next steps
Make the changes in the live service and use Google Analytics, Microsoft Clarity and the confidence check dashboard to monitor the changes.