
The data catalogue page
The Explore education statistics data catalogue is designed to help researchers, analysts, and the public find and download published data sets for offline analysis. The platform has so far published over 1,000 individual data sets, each with multiple updated versions across several years. Given this data collection is the core element that underpins the whole purpose of the platform, it is essential that we have a way for users to navigate this complex wealth of information.
View the current data catalogue
Current key features of the Page
Search and Filter: You can search for specific data sets by keyword or filter them by Theme (e.g., Schools, Higher Education, Social Care) and Publication.
Data Set Overviews: Each entry in the catalogue provides metadata to help you understand what is in the file before downloading, including:
Geographic Levels: Shows if the data is National, Regional, Local Authority, or School-level.
Time Period: The academic or reporting years covered.
Indicators and Filters: A list of the specific variables (e.g., "Number of pupils," "Ethnicity," "Free school meal status") included in that data set.
File Size/Row Count: Information on the scale of the data (e.g., "75,658 rows").
Latest Data Status: It clearly marks which files are the "latest data" and which are historical versions.
API Access: Many data sets now include a tag indicating they are "Available by API," allowing developers to pull the data directly into their own applications or code.
Why have we made changes to this page
Back when we launched the public beta in March 2020, the service was just beginning to migrate from the old legacy service, where many data sets were only available as static PDFs or excel files.
By 2026 the data catalogue has grown to include over 1000 active data sets. In this period we have also introduced a public API allowing users to consume data in different ways, this had meant we have needed to adapt the user interface as the service has matured and user needs have evolved.
User needs
We defined the following core user needs based on feedback, surveys, interviews and contextual analysis with our user groups, starting back in discovery and evolving them over time.
I need easier access to and understanding of data within EES so that I can independently find and analyse the data I need without relying on analysts.
I need EES to be more intuitive and time-efficient so that I can quickly find the information I need without spending excessive time navigating the system.
I need downloadable data to be available in formats I can use such as CSV so that I can access and process the data efficiently.
I want access to an API feed so that my data is updated with minimum effort
The original data catalogue design
The first version of the data catalogue was based around the step by step process of the table tool and reusing the same user interface.
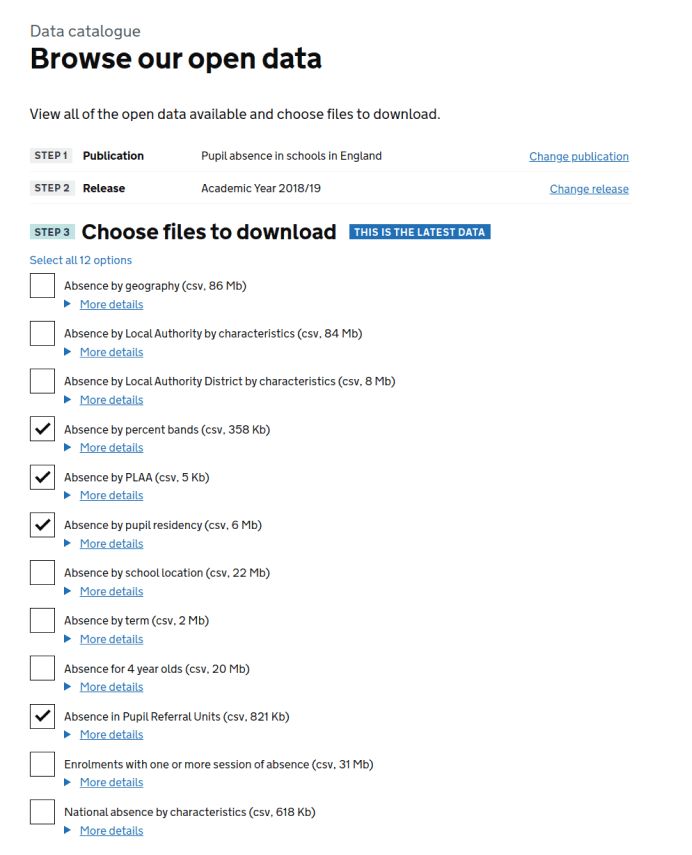
General user feedback noted that:
"You need to know what theme to look in to find data - it's not always obvious where to look"
We also had limited search capabilities at this stage which was also making it more difficult for users to find specific data sets
Data catalogue version 2
At this point the service had been in public beta for some time, and we now hosted hundreds more data sets than when we first started.
We were aware that we needed to make it easier to search through all these files and find a very specific data set.
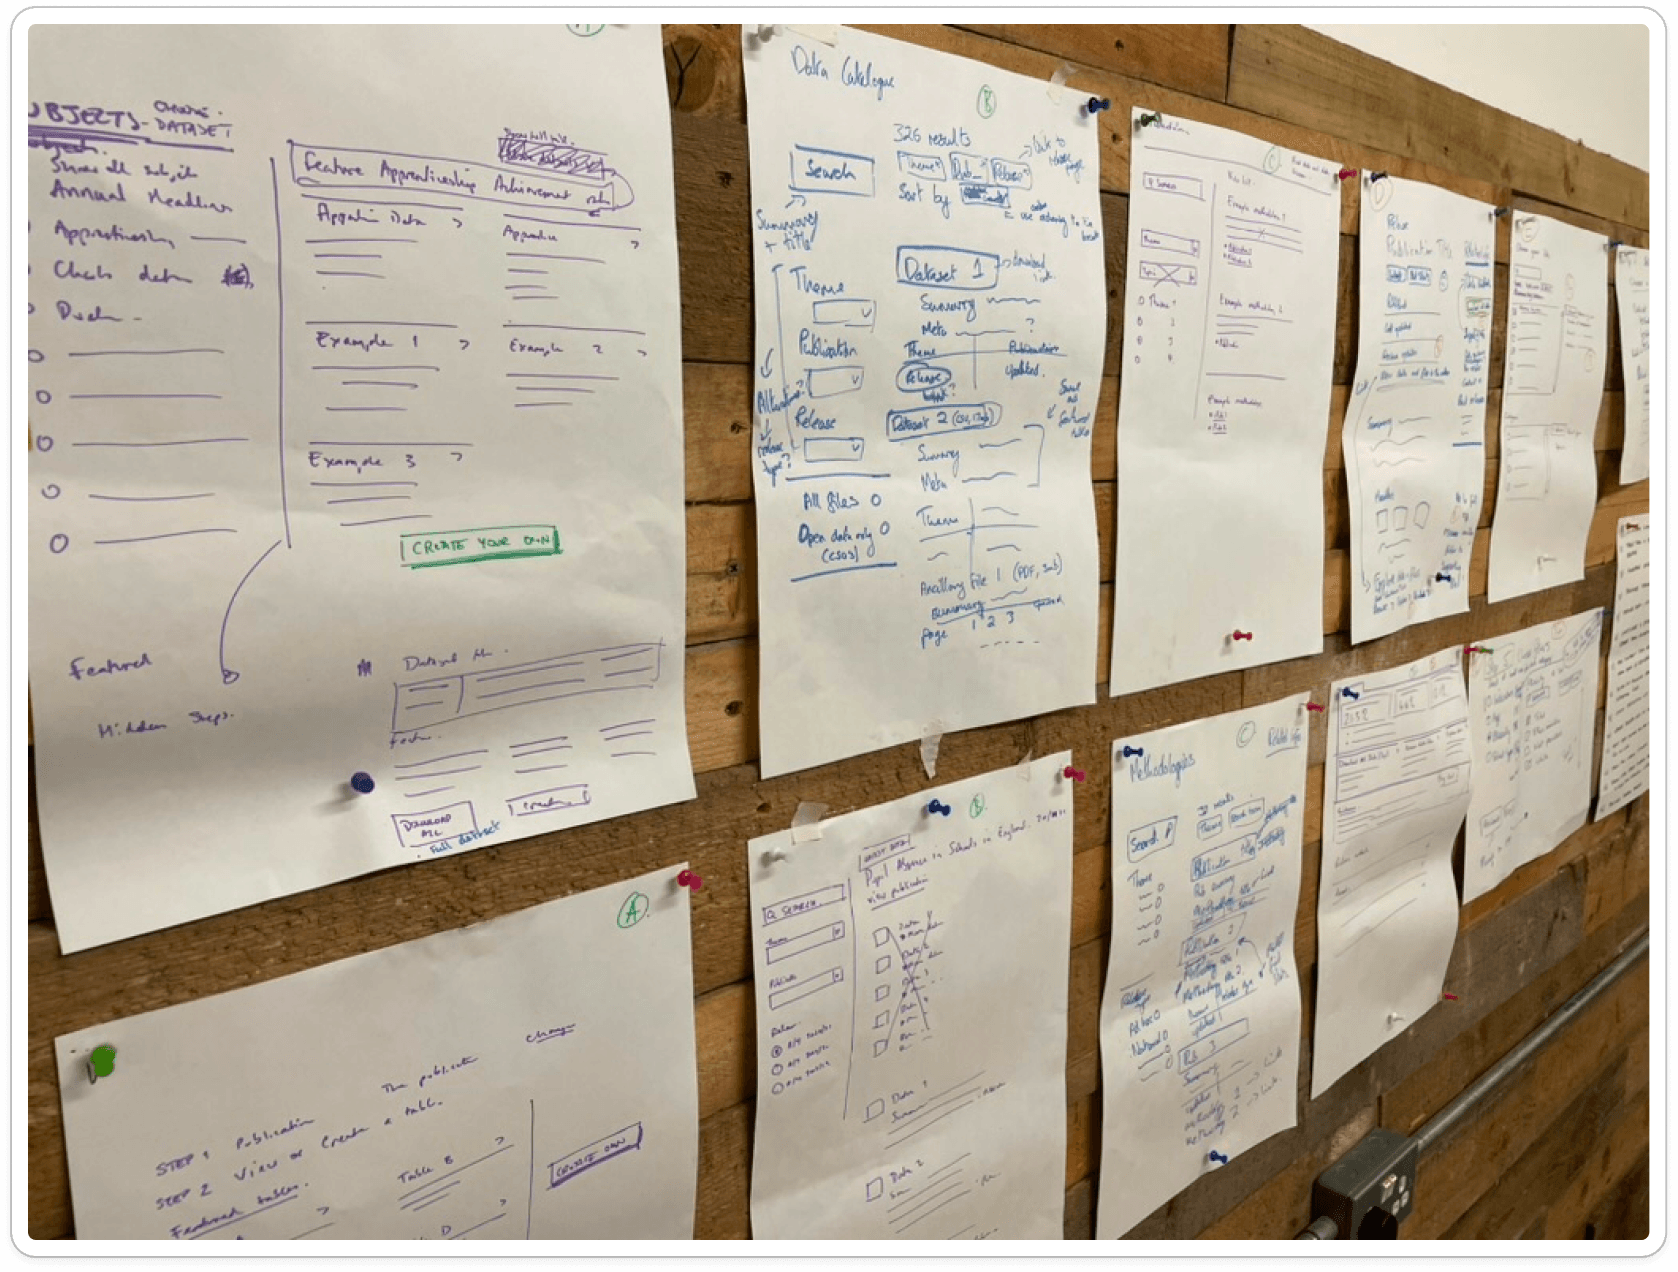
Collaborative sketching
We went back to the drawing board and developed ideas with the rest of the team, based on user feedback, current user needs and the knowledge that we would soon be hosting thousands of individual data sets.
Ideas started to develop around a conventional search with filters. We iterated and refined the basic concept and developed an interactive prototype.
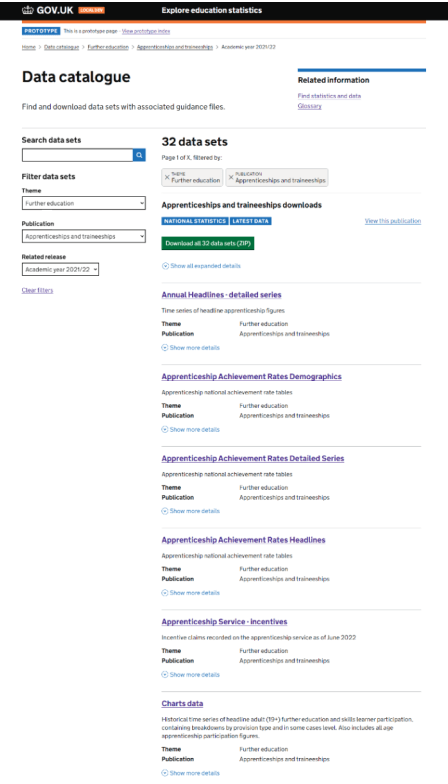
Prototype
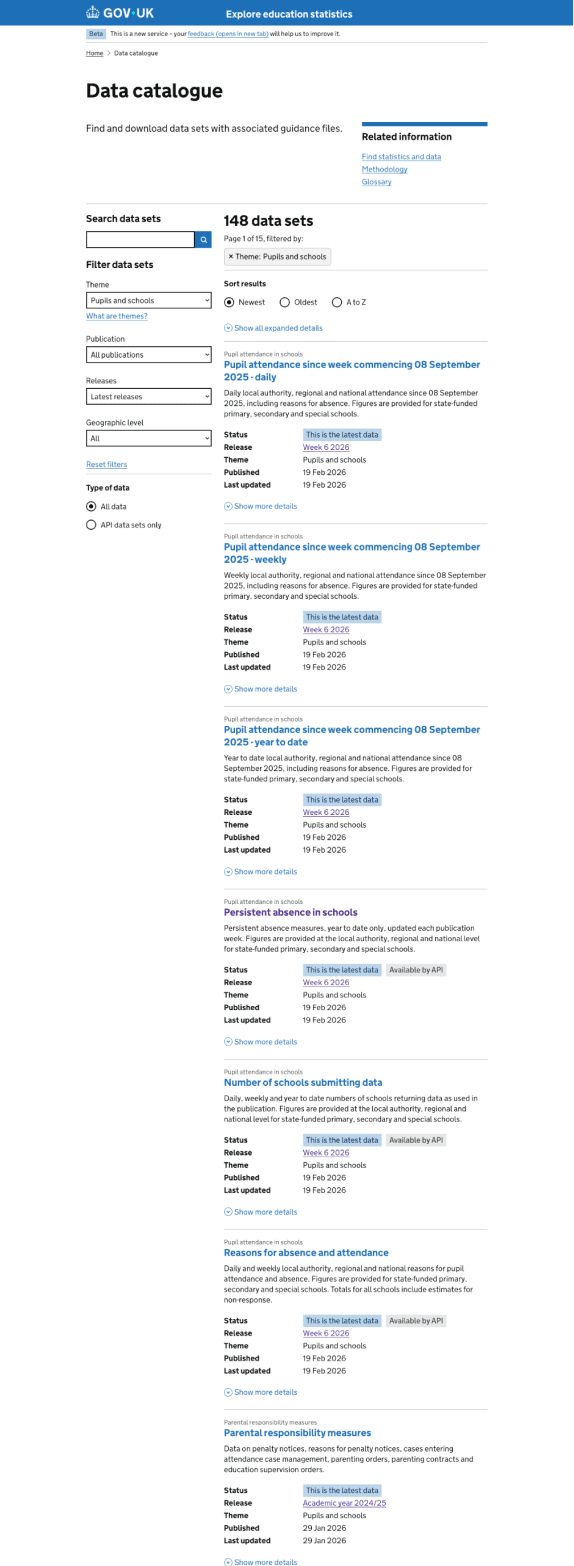
Data set results listings
The prototype lists all available data sets from across the entire service, this list can then be filtered to specific themes or publications, or the user can simply use the free text search.
Extra metadata can also be viewed under each result for more specific details.
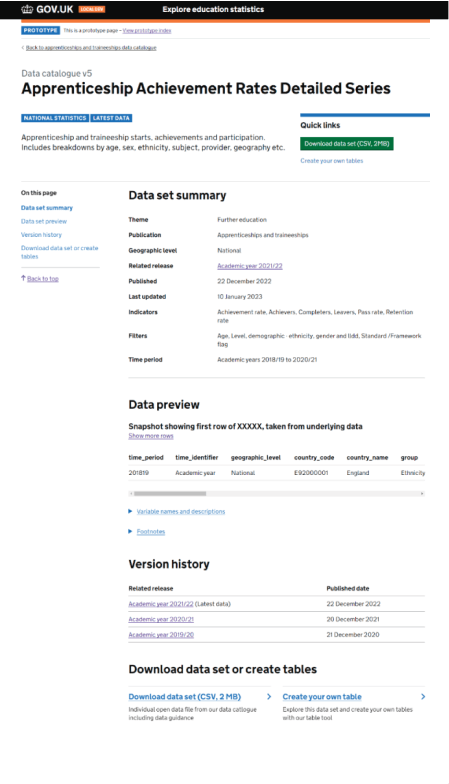
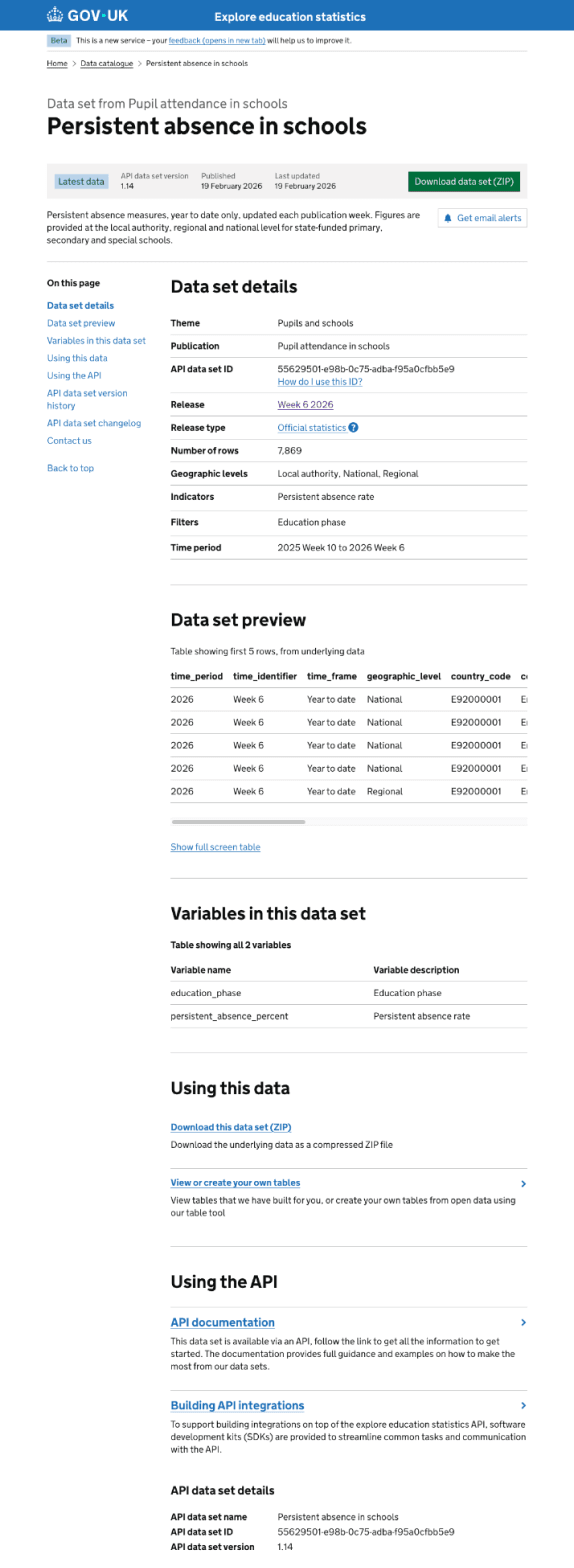
Data set landing page
We also created a stand alone data set landing page with full details, and data preview. This allows users to fully understand the data before attempting to download.
Usability testing
We tested this prototype with a range of users including external professional analysts from a range of Local authorities, Data managers from schools and academies, non professional users and internal users from the DfE stats production teams.
Data set results listings
Generally users found that the results listing page worked well as it was a familiar design pattern.
"It's a familiar format, that is nice because I'm not going to rethink anything"
Providing extra information about each data set was also important in enabling users to choose the correct data first time.
"I personally find showing filters and indicators useful, I like it, and it doesn't seem overwhelming."
Data set landing page
Users found the page navigation useful, showing the contents of exactly what is on the page.
Most users found the data preview area very useful. This gives a very clear idea of the data structure before downloading a large file, reducing the need of trial and error in picking the correct data set.
"That's very good. So you don't need to actually look at the file to find if it has the information you need"
"Good to see a preview, save time having to download data to have a look at it first"
Current live version
In March 2025 we introduced the public API. We updated the data catalogue to list API data sets and also updated the landing page to show full details and instructions on using the API to allow users to automate data extraction in third party tools of their choice.
Data set results listings
We introduced filters for the API data sets. The default list shows everything, but can be toggled to show only API data sets.
Data catalogue showing API data sets
Sample user feedback:
"Really useful be able to show API data sets, can choose between CSV downloads or API data sets"
"It looks like I could find something and then connect, click into the link and it will give me an API link."
Data set landing page
We added all the extra information about using the data via an API alongside conventional open data downloads to a single file.
Sample user feedback from API users:
"Quick start 'Using the API section' - It's really sensible that you've got all that in there."
"The first thing I would go for would be a API documentation that that would be where I'd look first on"
"I think this will meet the demands of very different audiences."
"People like me just like to get their hands on it without manually having to go in, this is gonna be so useful."
"Having the change log is also very useful because then if something breaks I could go, alright, I could go into this, look at the change log and go, alright, OK, these things have changed."
What's next
We are investigating consolidating the 'Data catalogue' and 'Find statistics' pages into a single user journey. Using the more powerful Azure AI search together with a faceted search pattern, this will allow users to quickly retrieve the relevant information, whether this is a published release with full commentary or the raw underlying data files.
We have developed an initial interactive prototype to explore the concept, with initial feedback from users has been positive.
We have also also presented this concept at a DfE design crit session and taken feedback from this wider DfE design community.
We are currently iterating this concept based on all our feedback, and will be carrying out more rounds of usability testing in the near future.